How can we help users interpret their own medical data?
Technological advances are allowing people to track their own health in a variety of ways, representing a dramatic change in individuals’ control of their own wellness. However, research regarding patient interpretation of traditional medical tests highlights the risks in making complex medical data available to a general audience. We used mixed methods to explore how people interpret such test results.
tl;dr
• User are increasingly tracking their own health data, but there are risks in making complex medical data available to a general audience
• We used mixed methods to determine how people interpret medical test results from a mobile blood testing system
• While most users are accurate in their interpretations of results, almost half express uncertainty and confusion about their ability to correctly do so
• Demographics and interface design impact interpretations, especially false confidence (a user being very confident in their interpretation despite being wrong)
My Role
• Expanded research question based on our previous work and literature review
• Thematically analyzed results from in-lab user study (N=27)
• Screened and recruited select participants using Qualtrics
• Statistically analyzed results from large, online study (N=303)
• Wrote paper sharing findings
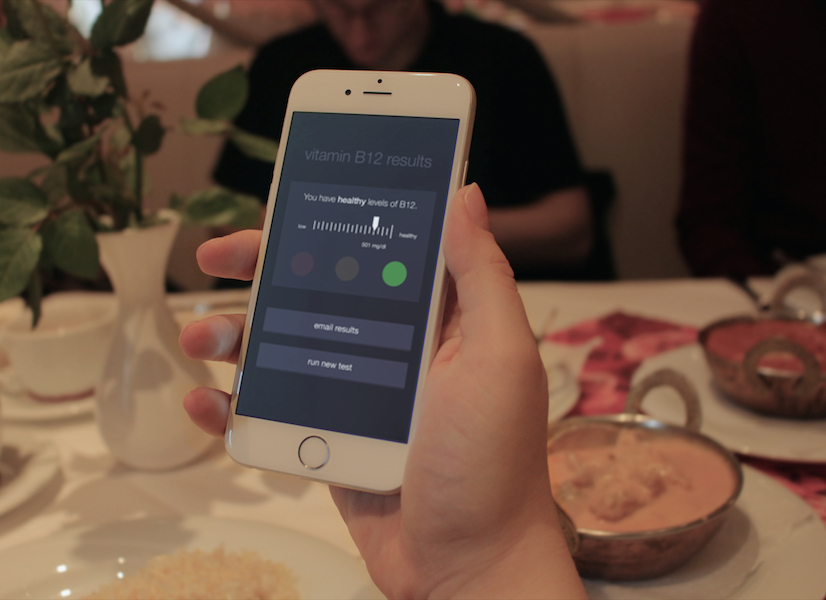
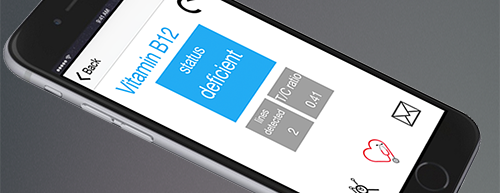
To investigate users’ interpretation of health data outside of a clinical context, we used NutriPhone, our prototype system that transforms any mobile device into a point-of-care biomarker assessment tool by combining blood testing strips, a custom hardware accessory, image analysis software, and a user-facing app that delivers diagnostic reports.
Methodology
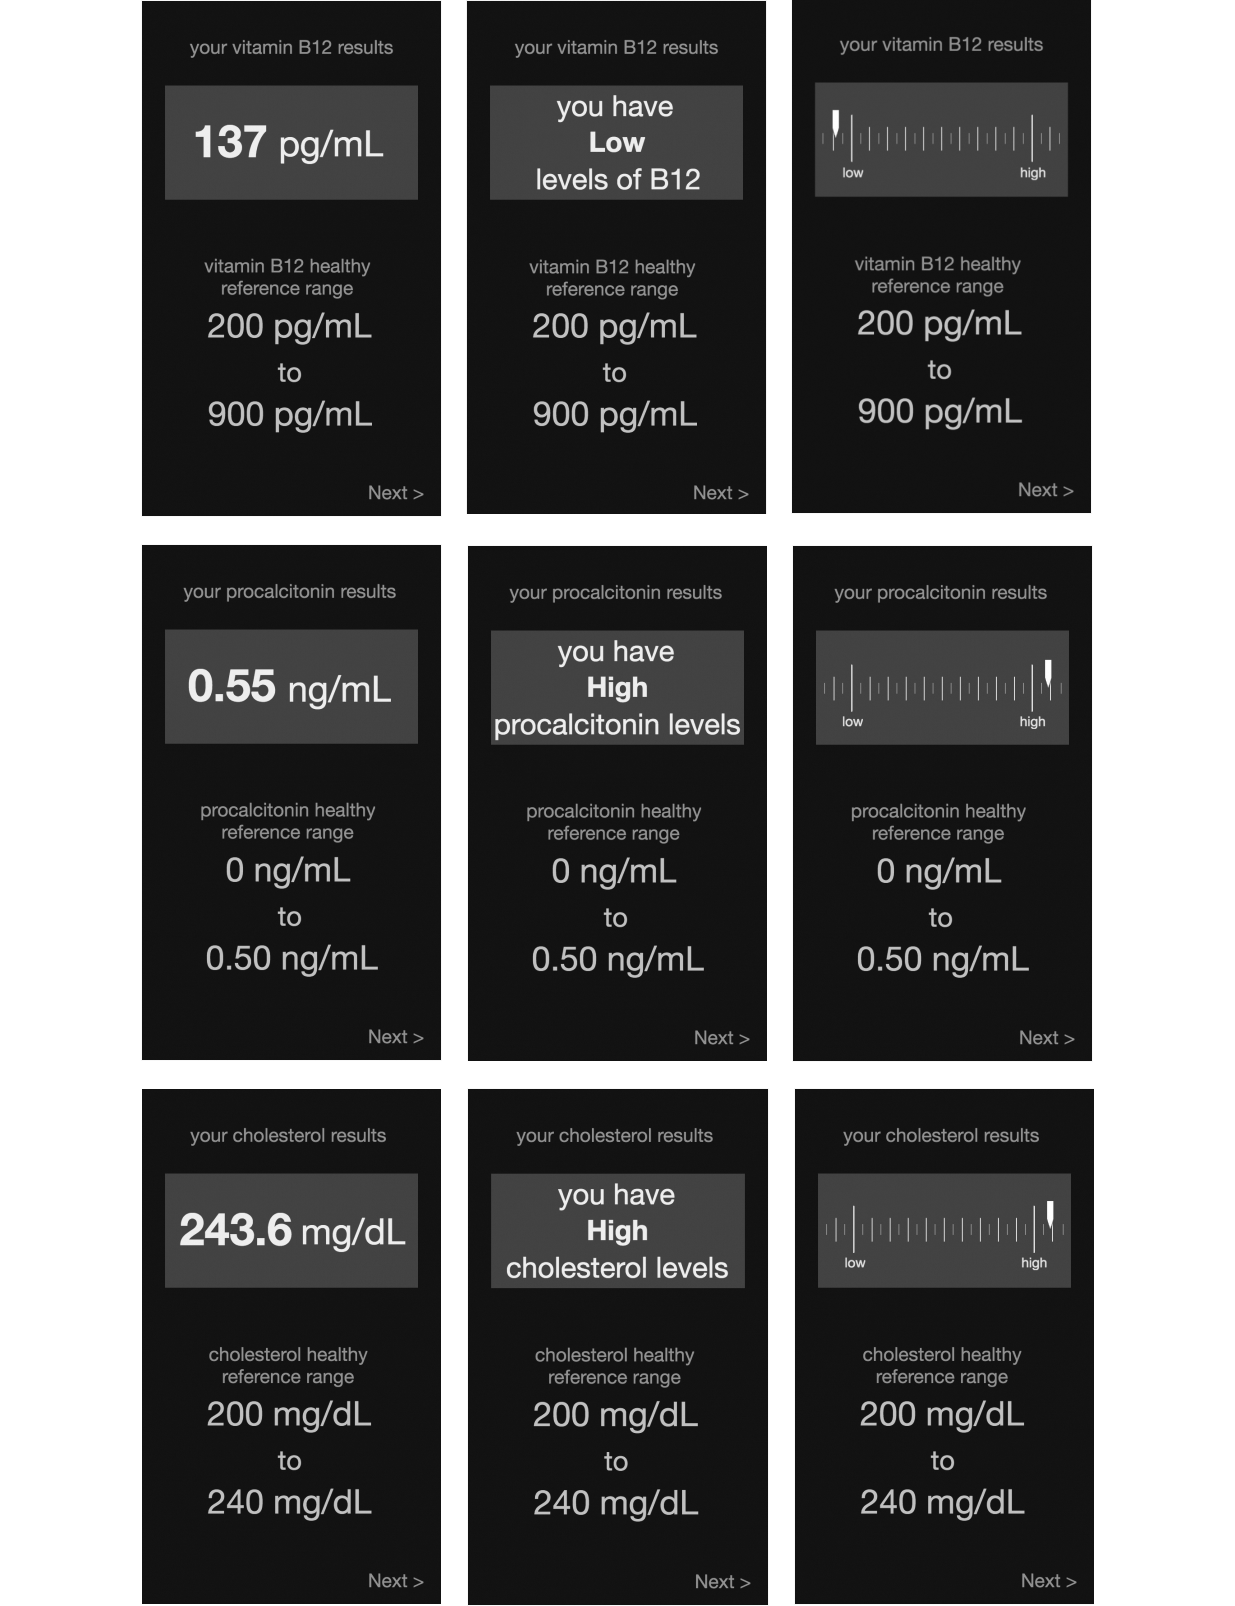
In a preliminary in-lab investigation (N=27) and large, online survey (N=303), we presented participants with hypothetical results from several blood tests via one of the several mobile interface designs: a number representing the raw measurement of the tested biomarker, natural language text indicating whether the biomarker’s level was low or high, or a one-dimensional chart illustrating this level along a low-healthy axis.
Participants also told us about any follow-up actions they would take based on the result and how they envisioned, generally, using our proposed personal health system.
Main Findings
We find that a majority of participants (242/328, 73.8%) were accurate in their interpretations of their diagnostic results.
• However, 135 of 328 participants (41.1%) expressed uncertainty and confusion about their ability to correctly interpret these results.
We also find that demographics and interface design can impact interpretation accuracy, including false confidence, which we define as a respondent having above average confidence despite interpreting a result inaccurately.
• Participants who saw a natural language design were the least likely (421.47 times, P=.02) to exhibit false confidence
• Women who saw a graph design were less likely (8.67 times, P=.04) to have false confidence
• False confidence was more likely among participants who self-identified as Asian (25.30 times, P=.02), white (13.99 times, P=.01), and Hispanic (6.19 times, P=.04)
• With the natural language design, participants who were more educated were, for each one-unit increase in education level, more likely (3.06 times, P=.02) to have false confidence
Recommendations
A thorough understanding of the target audience is necessary before deploying any personal informatics tool.
Designers should employ hybrid feedback designs that include multiple representational modalities (eg, numbers, words, visual graphics), as this taps into different literacies to increase a display’s effectiveness.
• If it is not possible to include multiple types of feedback in the interface (e.g., mobile apps where screen space is limited or when presenting results from multiple tests simultaneously), use text-based feedback, where natural language is used to convey whether a result is “healthy,” “high,” or “low”
Include a “healthy reference range” along with any results given, especially for biomarkers or other health indicators with which a user is expected to have less preexisting knowledge.
Allow users to input personal details.
• Many participants expressed uncertainty about how such factors might influence their test results, which would in turn contribute to their lack of confidence in both their results’ reliability as well as their own assessment
For tests with vital consequences, use mobile health systems as a mediator between clinician and patient.